Summary
NFL underdogs have won 33.5% of games outright since 1999 (2,420 of 7,228), and that rate has not moved in 27 seasons. The oddsmakers price the league accurately in aggregate; the only places money was made were narrow slices of the underdog pool.
• Parity is flat, not rising. The underdog win rate averaged 33.7%, 33.4% and 33.4% across the three nine-season eras. Year-to-year swings (2.9 points) are exactly what random chance produces on ~265 games a season.
• The spread is a clean predictor. Dogs of 3 or fewer points win 44.8% of the time; dogs of 14+ win 8.8%. Every step up in spread lowers the win rate.
• Big upsets got rarer. Dogs of 10–13.5 points won 21.3% in 1999–2007 and about 15% since 2008. This is the one real competitive trend in the data, and it is mostly road teams.
• The market now makes more home teams underdogs. Home teams were 32% of all underdogs in 1999–2007 and 39% in 2017–2025 (42% in 2025). Books value home field less than they used to.
• Betting every underdog against the spread lost money, but only slightly. $100 on all 7,322 underdogs (1999–2026) lost $4,113, a −0.6% return. The spread is so well set that dogs cover about 51% of the time, just under the ~52% needed to break even after the bookmaker's cut.
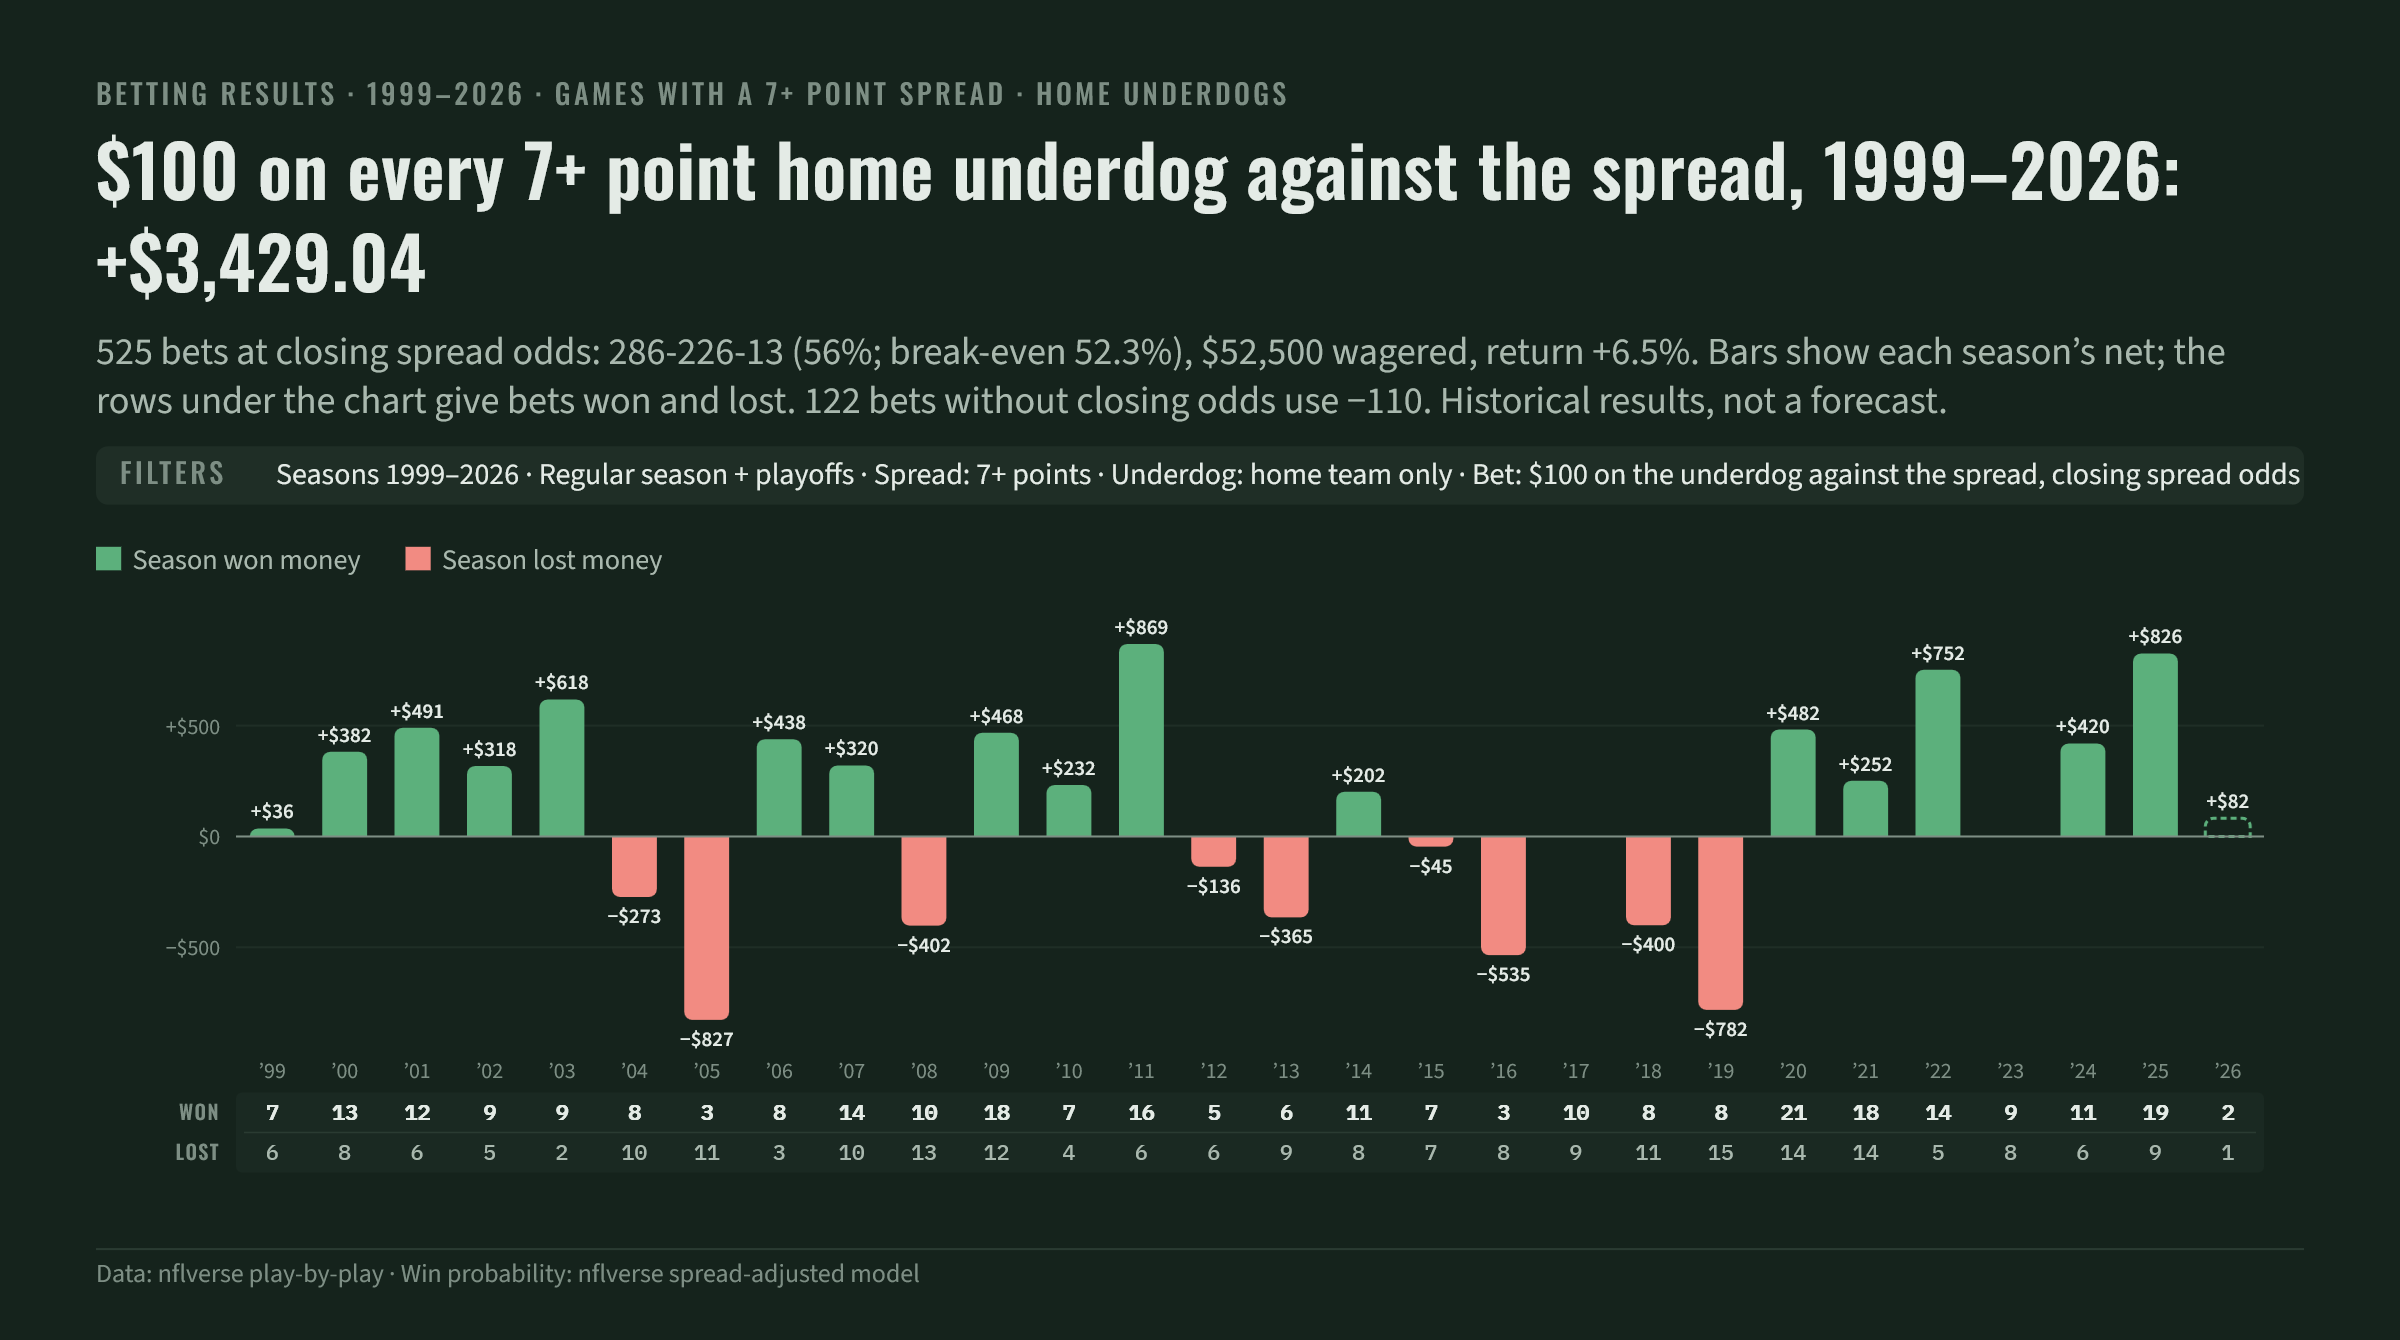
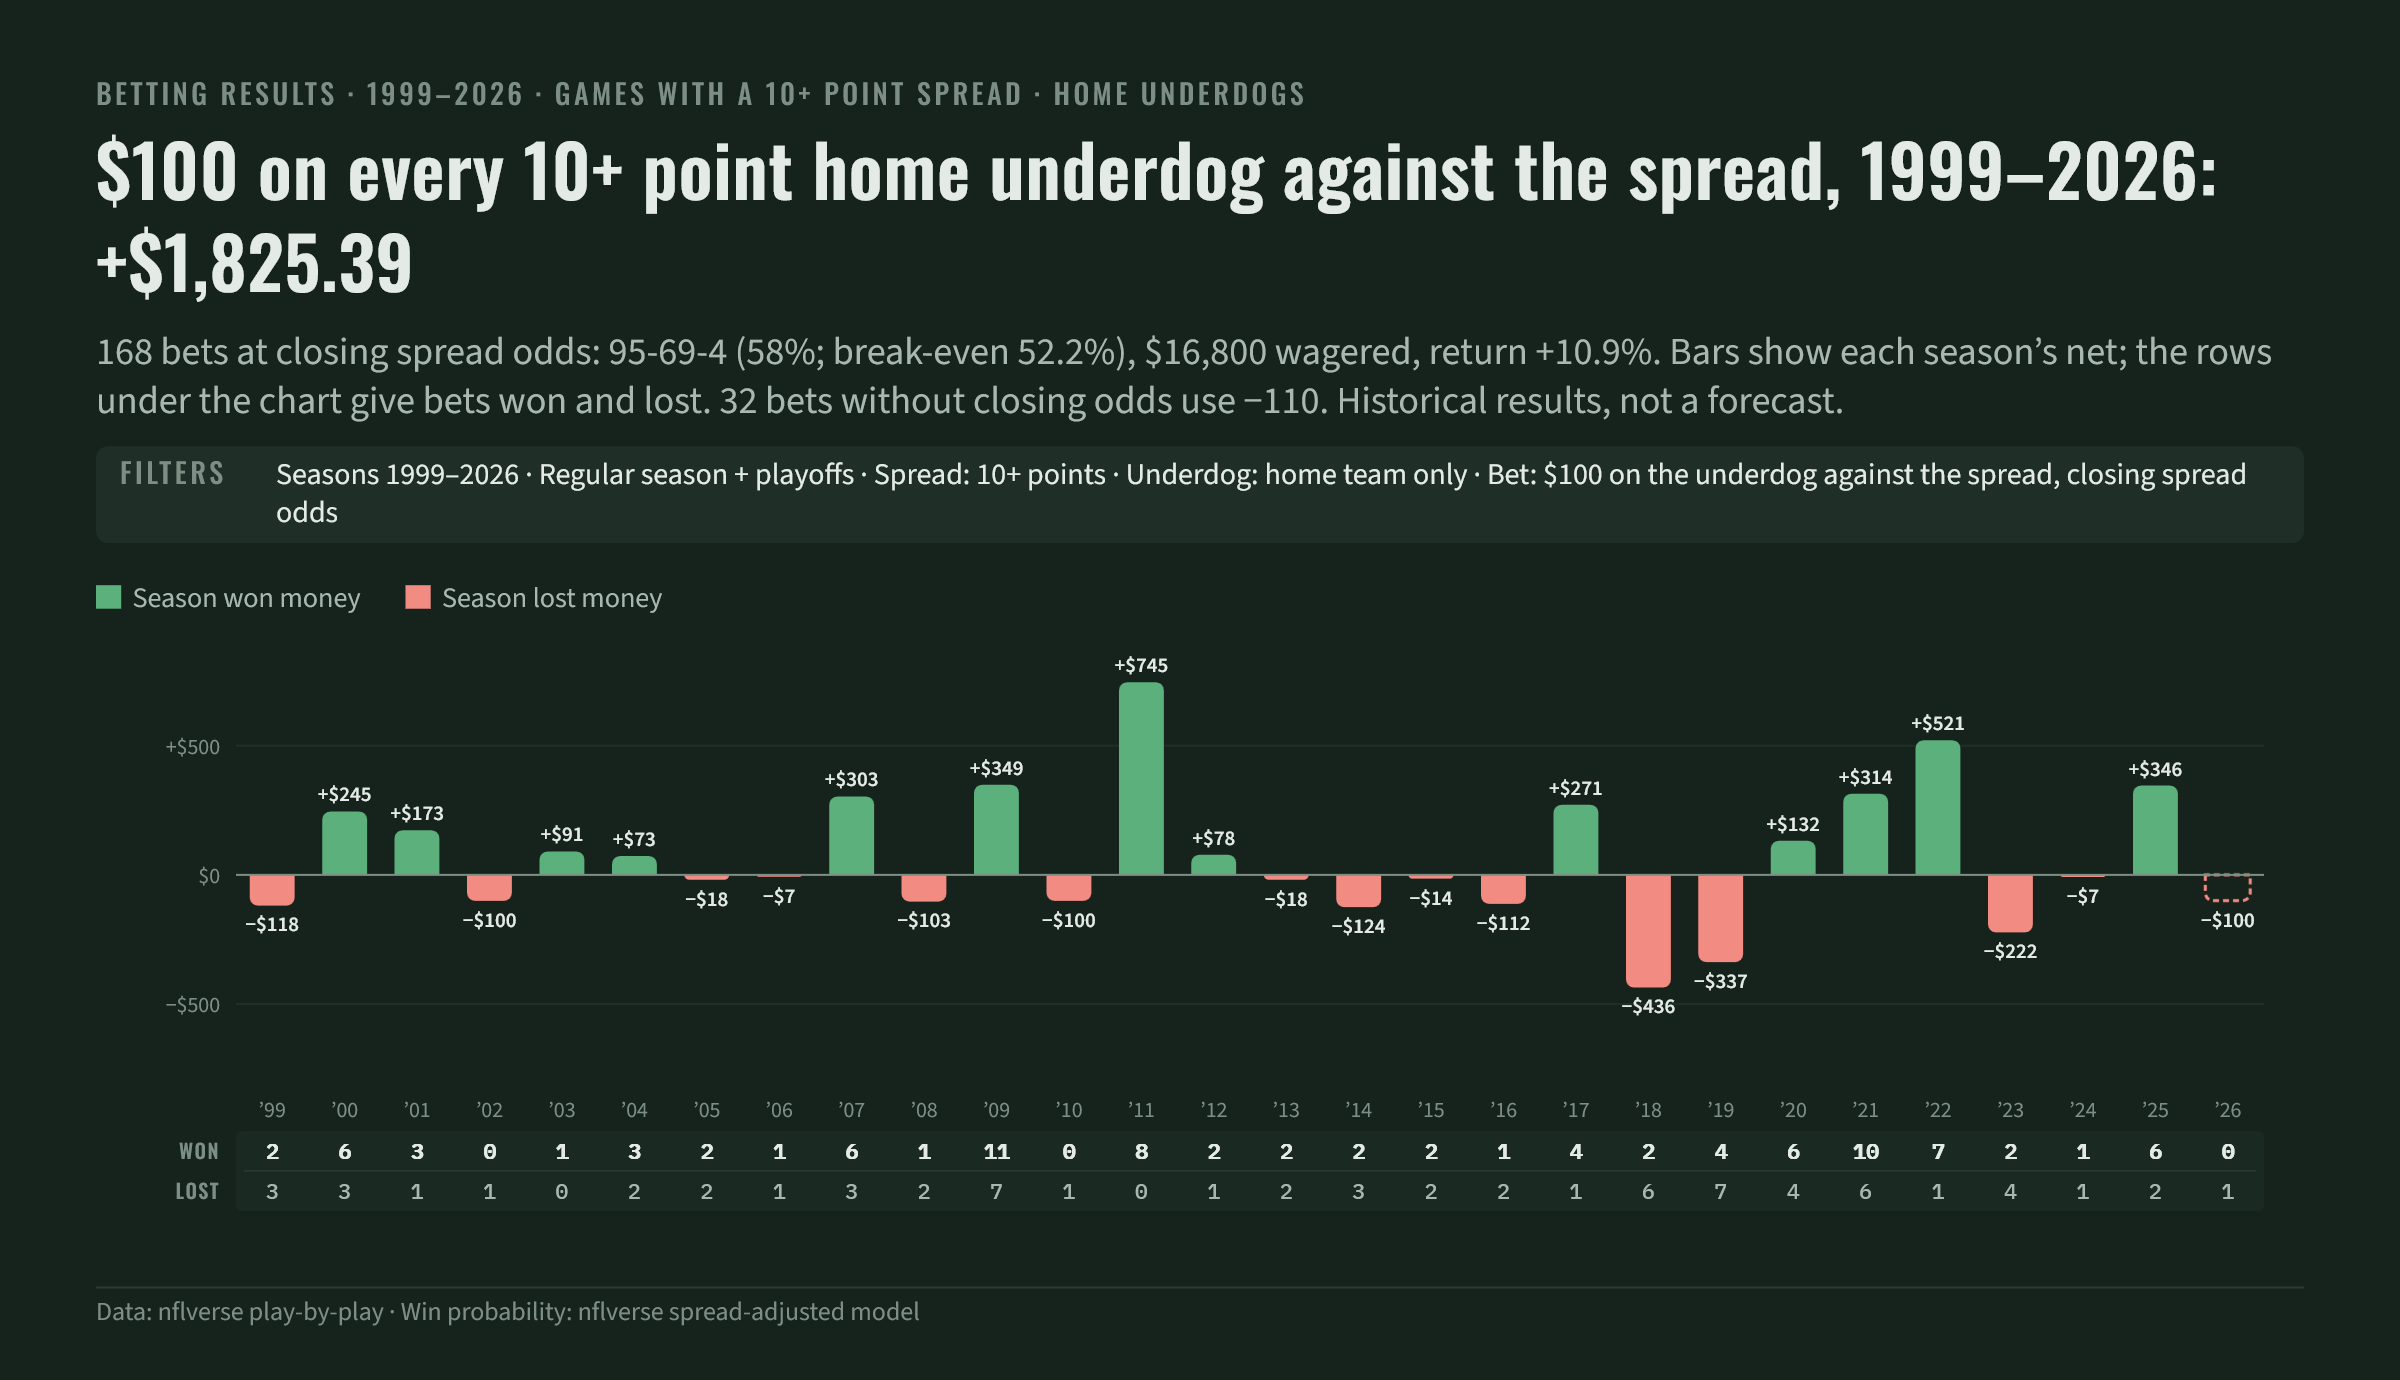
• One scenario stands out: big home underdogs. Home dogs of 7+ points returned +6.5% ($3,429 on 525 bets) and home dogs of 10+ returned +10.9% ($1,825 on 168 bets). Big road dogs lost money. The sample is small enough that this is a lead to test, not a proven system.
League-wide competitiveness over time
The NFL is no more or less predictable today than it was in 1999: the underdog win rate has no trend at all (a slope of −0.01 points per season).
Across three nine-season eras, underdogs won 33.7% (1999–2007), 33.4% (2008–2016) and 33.4% (2017–2025). The season-to-season wobble (2.9 points) is the same size chance alone would produce on ~265 games, so a "year of upsets" is almost always noise. Only 2005 and 2006 fall outside the chance band, and they missed in opposite directions back-to-back.
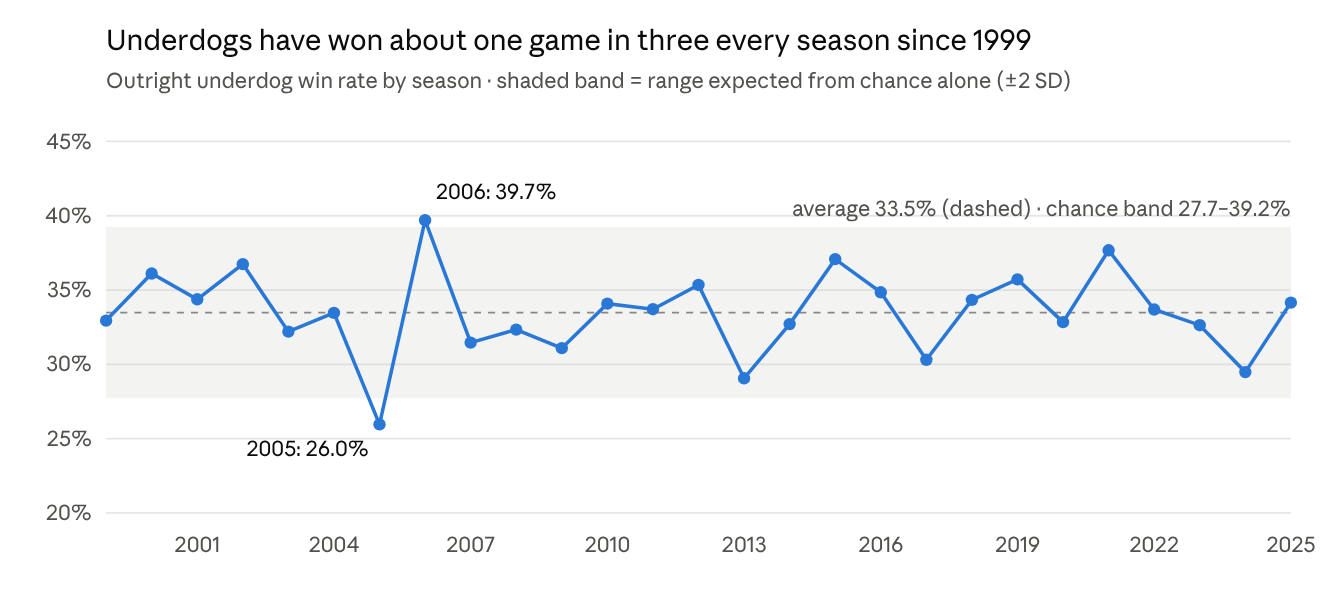
Across three nine-season eras, underdogs won 33.7% (1999–2007), 33.4% (2008–2016) and 33.4% (2017–2025). The season-to-season wobble (2.9 points) is the same size chance alone would produce on ~265 games, so a "year of upsets" is almost always noise. Only 2005 and 2006 fall outside the chance band, and they missed in opposite directions back-to-back.
Handicapping trends
The point spread does its job: every step up in spread lowers the underdog's chance of winning, from 44.8% at 3 points or less to 8.8% at 14+, and that ladder has held in every era.
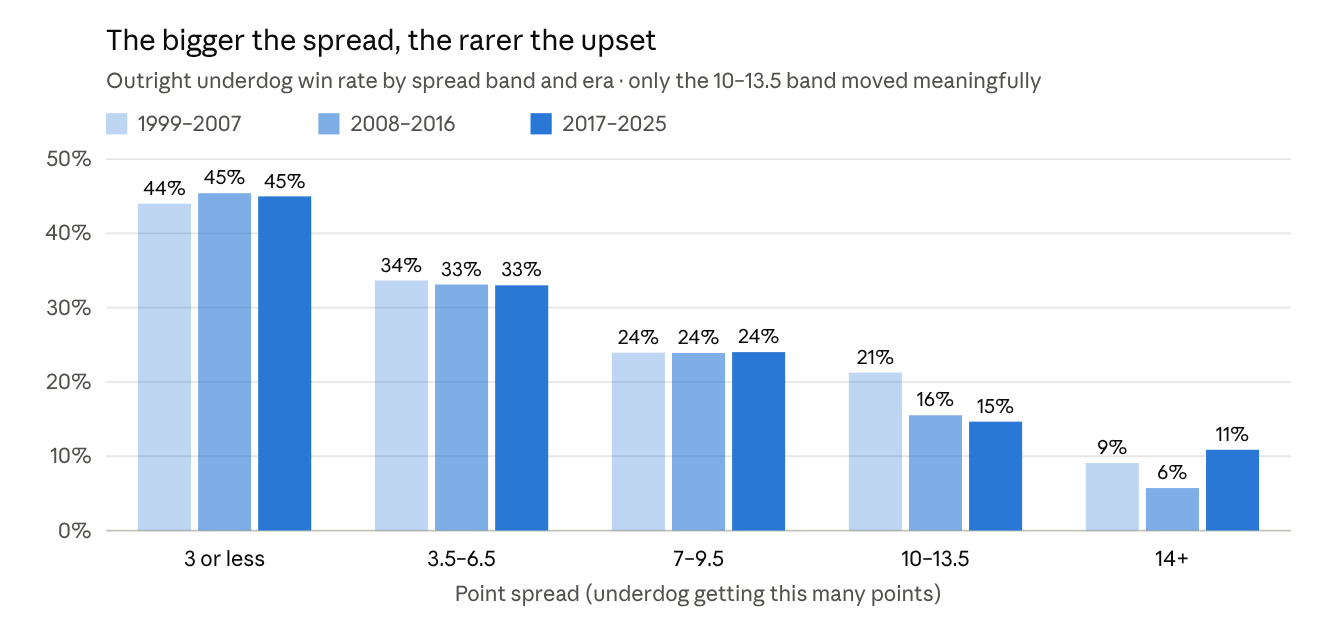
What moved: dogs of 10–13.5 points won 21.3% in 1999–2007 but only 15.5% and 14.7% in the two eras since. Big favorites have become more dependable, either because oddsmakers price mismatches better or because the gap between the best and worst rosters widened.
What did not move: close games (3 or less), mid-sized spreads (3.5–6.5) and 7–9.5-point games are all within a point of where they were in 1999. The 14+ band bounces between 6% and 11%, but on only 55–92 games per era it is too small to call a trend.
Home vs. away underdogs
The biggest structural change in the data is who the underdogs are: oddsmakers now make home teams the underdog far more often, a direct sign they value home-field advantage less than they did 20 years ago.
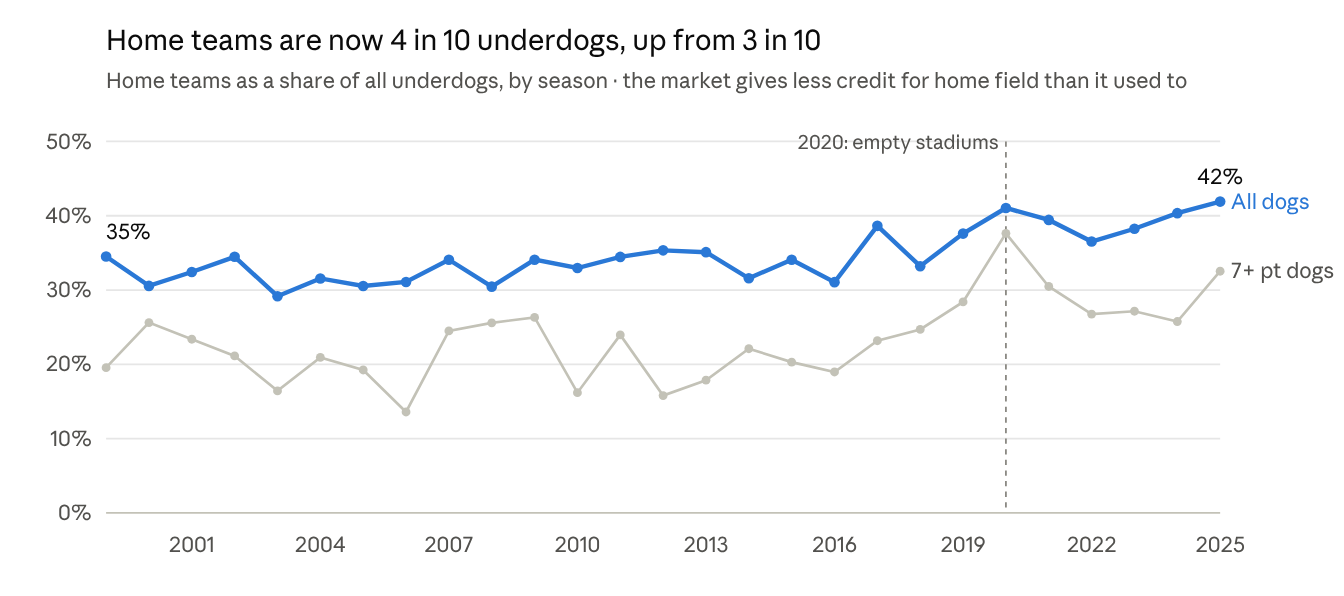
Home teams were 32% of underdogs in 1999–2007, 33% in 2008–2016 and 39% in 2017–2025, reaching 42% in 2025. Among 7+ point dogs, the home share rose from about 21% to 29%. The step-up began in 2017, jumped in 2020 when stadiums were empty, and never reversed after fans returned.
• Home dogs still win more often overall, but their edge over road dogs shrank from 4.0 to 1.9 points as the pool filled with teams that used to be small favorites.
• At short spreads, road dogs win slightly more often. At 3 or less and 3.5–6.5, road dogs match or beat home dogs in every era. "Take the home dog" does not hold at small numbers.
• The decline in big upsets is a road-team story. Road dogs of 10–13.5 fell from 20.9% to 12.1%; home dogs at that number held near 22%.
• The 7–9.5 band flipped. Home dogs fell 10.6 points while road dogs rose 4.1. With 108–343 games per cell, this is worth testing, not yet worth acting on.
This split matters for the money: as the next section shows, the scenario where big home dogs held their outright win rate is the same one where betting them against the spread made money.
The financial side: $100 betting scenarios
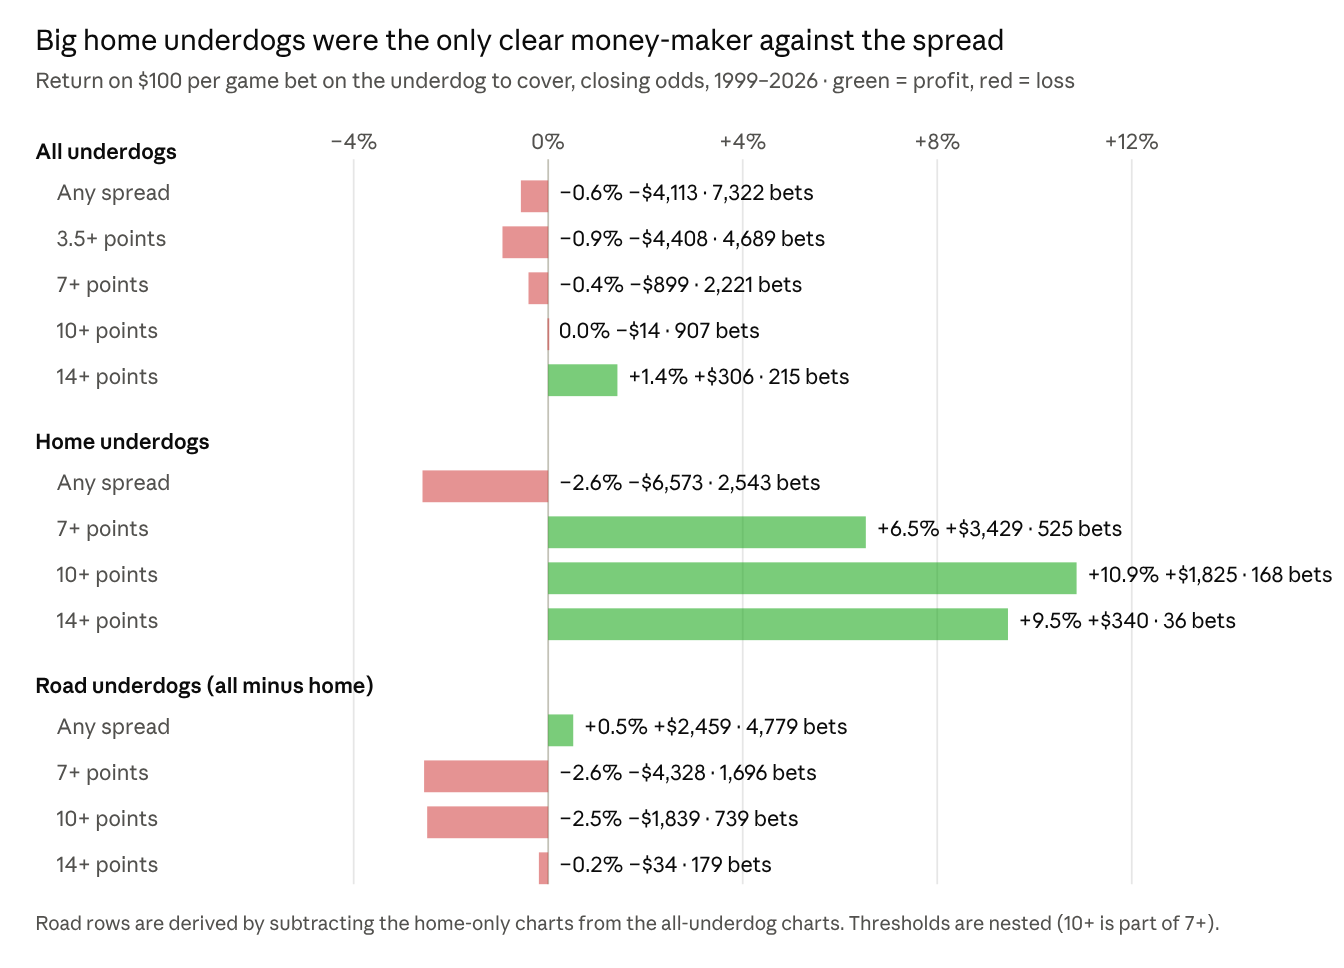
Betting $100 on every underdog to cover the spread from 1999 to today would have lost $4,113 on $732,200 wagered, a −0.6% return: close to break-even, and only one narrow slice of underdogs turned a profit.
How these bets work. Assumes the same $100 bet on the underdog in every qualifying game, at the closing spread odds. The bet wins if the underdog wins outright or loses by less than the spread. Because the bookmaker charges a fee (roughly $110 risked to win $100), a bettor needs to win about 52% of decided bets to break even. Underdogs as a whole covered 51.3% of decided bets (3,656 won, 3,466 lost, 200 refunded), just short of that line.
What the scenarios show
• Blind underdog betting is a slow leak, not a windfall. Every broad strategy (all dogs, 3.5+, 7+) lost between 0.4% and 0.9%. Season results swung widely, from roughly +$5,000 in the best year to about −$5,300 in the worst, so a single good season proves nothing.
• Bigger spreads moved toward break-even. 10+ dogs finished essentially flat (−$14 on 907 bets) and 14+ dogs slightly positive (+1.4%). Fewer upsets happen at these numbers, but the spread compensates by letting the dog lose by a lot and still cover.
• Home underdogs overall were the worst bet. They lost $6,573 (−2.6%). Subtracting the 7+ chart from the all-home chart, home dogs getting fewer than 7 points lost about $10,000 on 2,018 bets (−5.0%). Small home dogs are the trap in this data.
• Big home underdogs were the best bet. Home dogs of 7+ covered 55.9% of decided bets for +$3,429 (+6.5%); at 10+ they covered 57.9% for +$1,825 (+10.9%). This matches the outright data, where big home dogs kept winning about 22% while big road dogs faded.
• Road underdogs were the mirror image. By subtraction, all road dogs made a small profit (+$2,459, +0.5%), but road dogs of 7+ lost $4,328 (−2.6%) and of 10+ lost $1,839 (−2.5%).
How much to trust the winners. On 512 decided bets, the 7+ home-dog cover rate of 55.9% sits about 1.6 standard errors above break-even; the 10+ home-dog rate is about 1.5 standard errors above on 164 bets. Neither clears the usual bar for statistical confidence, and both were found by looking at ten scenarios and picking the best. Treat them as hypotheses to test on future seasons, not as a betting system. Also note that 27% of all chart bets used an assumed −110 price because closing odds were missing.
For non-bettors: the takeaway is that the betting market is extremely efficient. Across 27 seasons, the gap between betting every underdog and breaking even was less than one cent per dollar wagered.